
Video tutorial
1. What is PancanQTL?
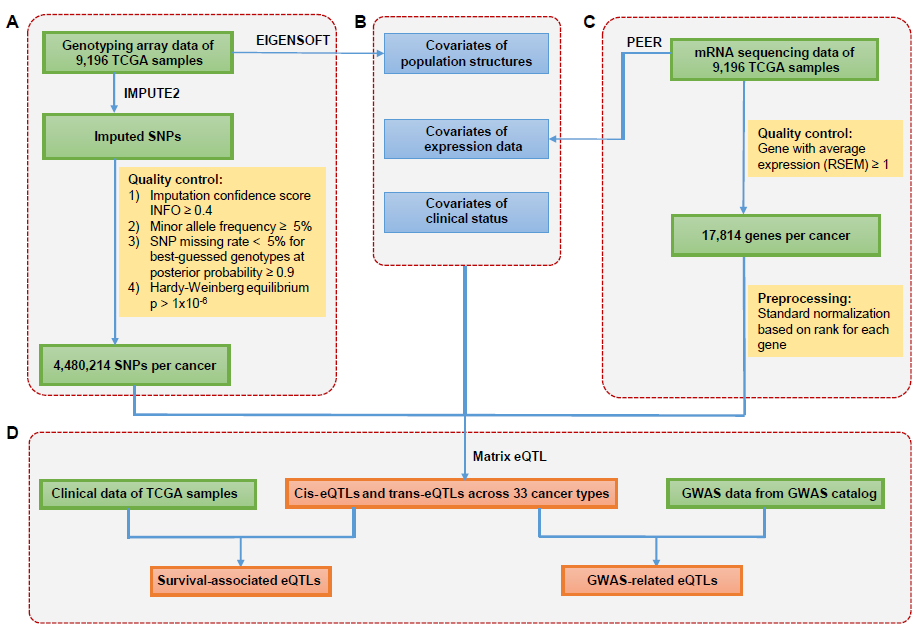
PancanQTL is a database to provide a comprehensive resource of expression quantitative loci (eQTLs) across 33 human cancer types.
In PancanQTL, users can:
2. Database construction pipeline
3. Data summary
|
Cancer type
|
Full name
|
No. of samples
|
No. of genes
|
No. of genotypes
|
Cis-pairs
|
Cis-egenes
|
Cis-eQTLs
|
Trans-pairs
|
Trans-egenes
|
Trans-eQTLs
|
|---|---|---|---|---|---|---|---|---|---|---|
| ACC | Adrenocortical carcinoma | 77 | 17562 | 3678145 | 4610 | 222 | 4558 | 984 | 60 | 957 |
| BLCA | Bladder Urothelial Carcinoma | 408 | 18171 | 4242910 | 142562 | 5573 | 120374 | 9199 | 1575 | 3114 |
| BRCA | Breast invasive carcinoma | 1092 | 17991 | 2765921 | 438476 | 11859 | 317935 | 73124 | 6013 | 20466 |
| CESC | Cervical squamous cell carcinoma and endocervical adenocarcinoma | 300 | 17975 | 4367017 | 95702 | 4165 | 84484 | 2209 | 674 | 971 |
| CHOL | Cholangiocarcinoma | 36 | 17767 | 4106282 | 11 | 2 | 11 | 5011 | 127 | 4436 |
| COAD | Colon adenocarcinoma | 286 | 17500 | 4576984 | 164356 | 5048 | 145461 | 3085 | 373 | 2359 |
| DLBC | Lymphoid Neoplasm Diffuse Large B-cell Lymphoma | 48 | 17245 | 4945365 | 391 | 15 | 391 | 5 | 3 | 5 |
| ESCA | Esophageal carcinoma | 184 | 18372 | 4563674 | 39358 | 1603 | 36589 | 425 | 56 | 410 |
| GBM | Glioblastoma Multiforme | 150 | 17650 | 4660522 | 59788 | 1901 | 55855 | 481 | 55 | 465 |
| HNSC | Head and Neck squamous cell carcinoma | 518 | 17985 | 4302347 | 267797 | 6502 | 228069 | 9285 | 1064 | 7389 |
| KICH | Kidney Chromophobe | 66 | 17212 | 3902792 | 7264 | 320 | 7038 | 5826 | 157 | 4669 |
| KIRC | Kidney renal clear cell carcinoma | 527 | 17812 | 4632879 | 521072 | 8739 | 410720 | 13978 | 943 | 12200 |
| KIRP | Kidney renal papillary cell carcinoma | 290 | 17715 | 4981141 | 186310 | 4920 | 164159 | 2712 | 302 | 2516 |
| LAML | Acute Myeloid Leukemia | 123 | 17099 | 5245402 | 70375 | 1758 | 64696 | 580 | 38 | 397 |
| LGG | Lower Grade Glioma | 515 | 17563 | 4688205 | 578617 | 9177 | 437580 | 21236 | 1804 | 13084 |
| LIHC | Liver hepatocellular carcinoma | 369 | 17816 | 4218042 | 151613 | 5723 | 128956 | 16675 | 2230 | 3963 |
| LUAD | Lung adenocarcinoma | 514 | 18190 | 4435432 | 259475 | 6834 | 220709 | 6157 | 745 | 4513 |
| LUSC | Lung squamous cell carcinoma | 500 | 18277 | 3787605 | 204145 | 6367 | 173856 | 11934 | 1050 | 10487 |
| MESO | Mesothelioma | 87 | 17742 | 4904165 | 16527 | 475 | 16140 | 474 | 43 | 471 |
| OV | Ovarian serous cystadenocarcinoma | 301 | 18137 | 3018011 | 92743 | 7100 | 74419 | 6196 | 2028 | 2245 |
| PAAD | Pancreatic adenocarcinoma | 178 | 18021 | 5099858 | 113810 | 2468 | 104058 | 1221 | 110 | 978 |
| PCPG | Pheochromocytoma and Paraganglioma | 178 | 17552 | 4836419 | 93679 | 3203 | 83517 | 1146 | 241 | 985 |
| PRAD | Prostate adenocarcinoma | 494 | 17646 | 4887130 | 691299 | 10152 | 514457 | 15730 | 1105 | 11589 |
| READ | Rectum adenocarcinoma | 94 | 17427 | 4653098 | 22788 | 781 | 22114 | 72 | 14 | 72 |
| SARC | Sarcoma | 258 | 18183 | 4156361 | 70201 | 4194 | 61193 | 5704 | 1055 | 4115 |
| SKCM | Skin Cutaneous Melanoma | 103 | 17645 | 4968336 | 15046 | 720 | 14487 | 348 | 45 | 299 |
| STAD | Stomach adenocarcinoma | 415 | 18478 | 4362659 | 161271 | 4913 | 142709 | 2470 | 391 | 1994 |
| TGCT | Testicular Germ Cell Tumors | 150 | 18790 | 4927197 | 71832 | 1959 | 67882 | 653 | 39 | 599 |
| THCA | Thyroid carcinoma | 503 | 17277 | 4936390 | 927678 | 10766 | 659323 | 13592 | 745 | 8908 |
| THYM | Thymoma | 120 | 17785 | 5036992 | 85627 | 2090 | 78507 | 436 | 43 | 379 |
| UCEC | Uterine Corpus Endometrial Carcinoma | 176 | 18195 | 5111002 | 25426 | 1188 | 24721 | 251 | 35 | 248 |
| UCS | Uterine Carcinosarcoma | 56 | 18314 | 4036518 | 488 | 25 | 488 | 6 | 2 | 6 |
| UVM | Uveal Melanoma | 80 | 16758 | 4812283 | 26233 | 890 | 25260 | 5 | 4 | 5 |
4. The eQTL boxplot and survival Kaplan-Meier plot.
|
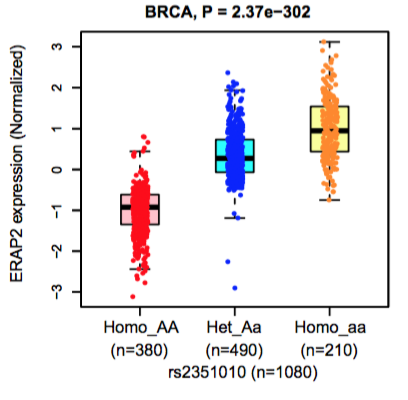
eQTL boxplot
|
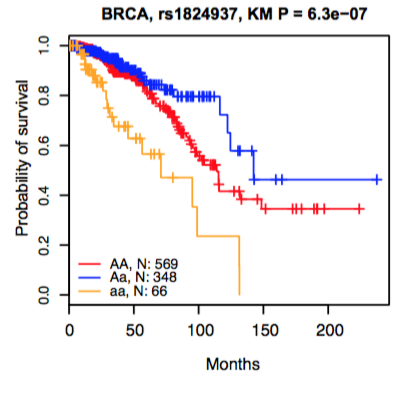
Kaplan-Meier plot
|
|---|---|
 |
 |
|
Boxplots represent the gene expression in individuals carrying homozygote AA, heterozygous Aa, and homozygote aa, respectively. |
Lines represent the survival curve for individuals carrying homozygote AA, heterozygous rs1824937 Aa, and homozygote aa, respectively. |
5. The identification of GWAS-related eQTLs
GWAS tagSNPs were downloaded from GWAS catalog website (http://www.ebi.ac.uk/gwas/) and the GWAS linkage disequilibrium regions were extracted from SNAP database (https://archive.broadinstitute.org/mpg/snap/ldsearchpw.php). eQTLs that overlapp with tagSNPs and/or linkage disequilibrium regions were extracted as GWAS-related eQTLs.